When it comes to doing a forensic investigation, we want to take the approach of looking wide, and then digging deeper into the data. This helps you avoid going down rabbit holes as much as possible and allows you to easily pivot to other data you’ve collected or taken note of. Now, for today’s example we’re going to go about this in a much lighter way, nothing like a full-fledged investigation that someone dedicated to DFIR would do.
We’re going to approach this as if you’re in one of the many roles where you might find yourself needing to dig into some alerts that have come into your Microsoft Defender portal. Furthermore, this is really aimed at those who are wearing many hats, such as I did early in my admin days, where I was a Skype admin, Exchange, Hyper-V and SCCM admin. Had some of these Microsoft tools been available like they are now at that point; I surely would have put that hat on much earlier!
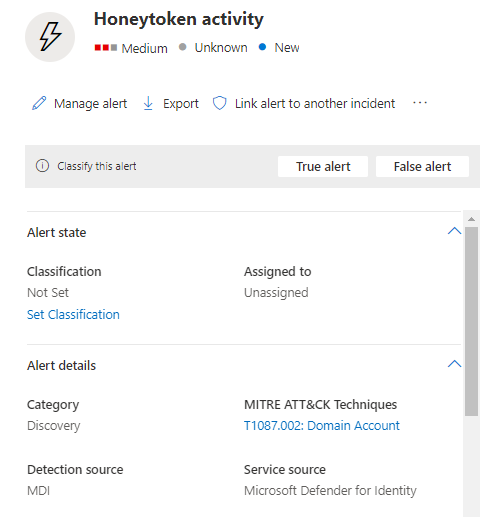
Alright so let’s set the stage, below in Figure 1.1 we have an alert that came in, some honeytoken activity. Right away I see that the source is from Defender for Identity (MDI), so in this case it’s one of the honeytoken accounts I set up or an account I tagged as one. There is plenty of information out there to help to understand where to use these if you need to learn more.
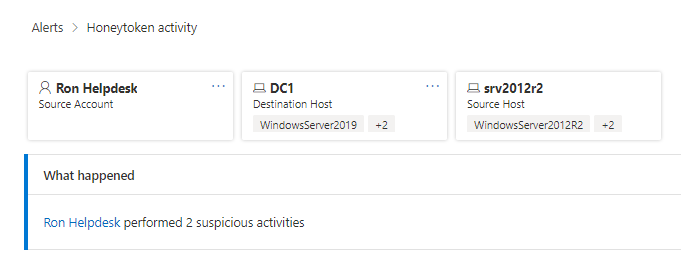
Okay so like I said, right now we’re searching wide, we’re gathering data before we start digging in. So, let’s take a look at what else this alert shows us. In Figure 1.2 we see some of the entities involved in this. I see we have on user account and two machine accounts involved, great, let’s note those and move on.
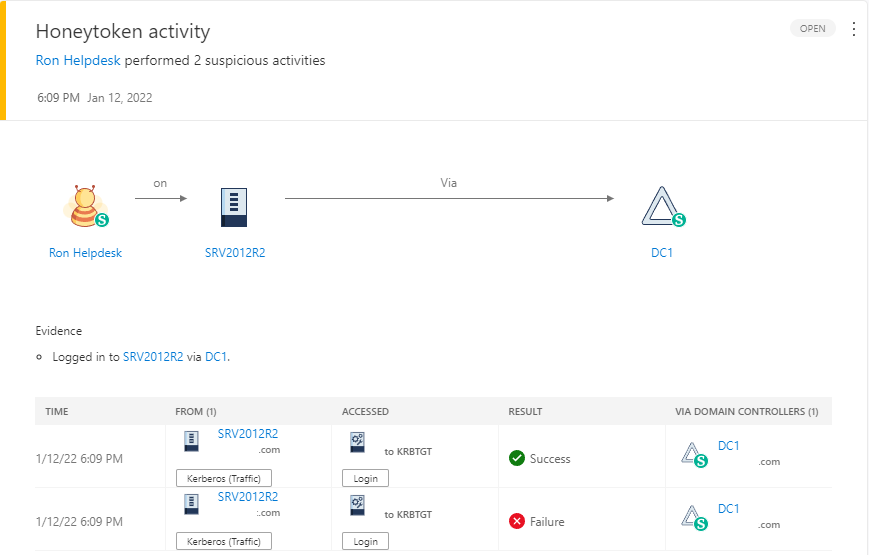
Since this is MDI, I like to still use the older portal, which you can find at yourdomain.atp.azure.com, as well as in the “More resources” in your M365 Defender portal. So, let’s head over there and see what we are shown about this. Figure 1.3 below shows us a nice illustration of what activity was apart of triggering this alert. We see Ron logged into SRV2012R2 via DC1, so far it just looks like a normal authentication. Here again, I’m taking notes about what I’m finding, things involved, timestamps…etc.
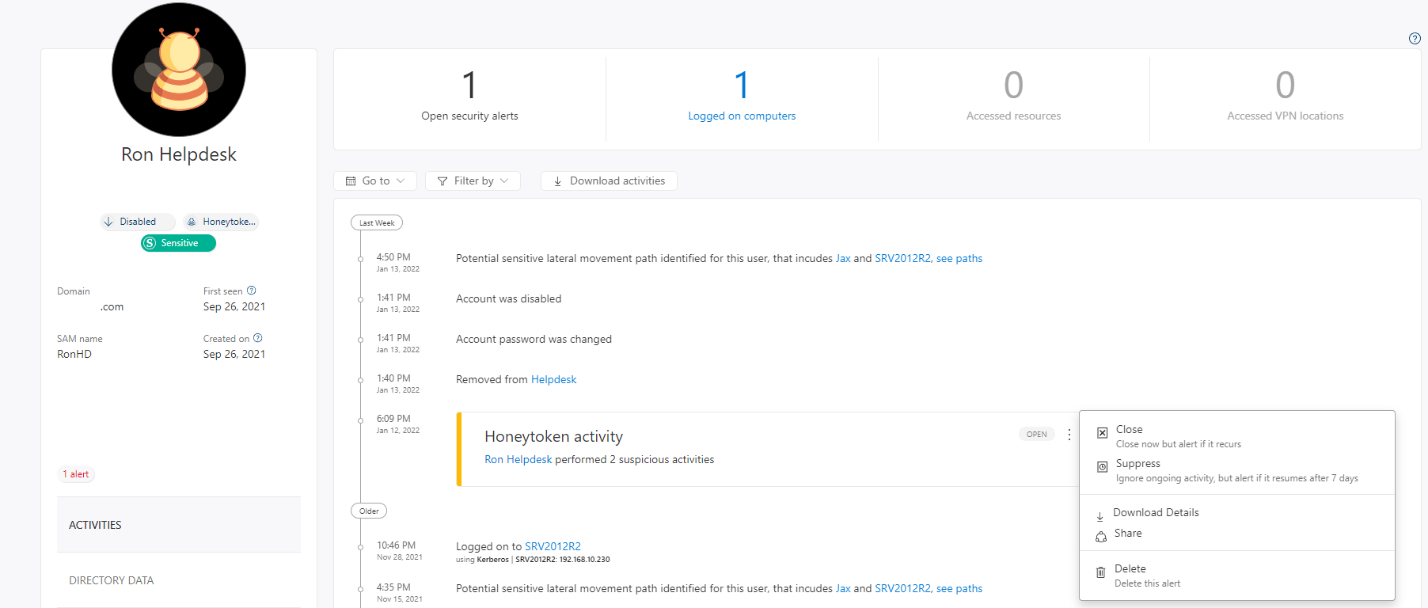
As I move forward, let’s go to that user entity page, and see what timeline activity we see for Ron. Below in Figure 1.4 we see some similar information that we’ve already documented, of course you can also see some remediation activity here as well where the account was disabled and removed from any groups. You can also see here that we can download details about that activity. That’s something else you would want to collect.
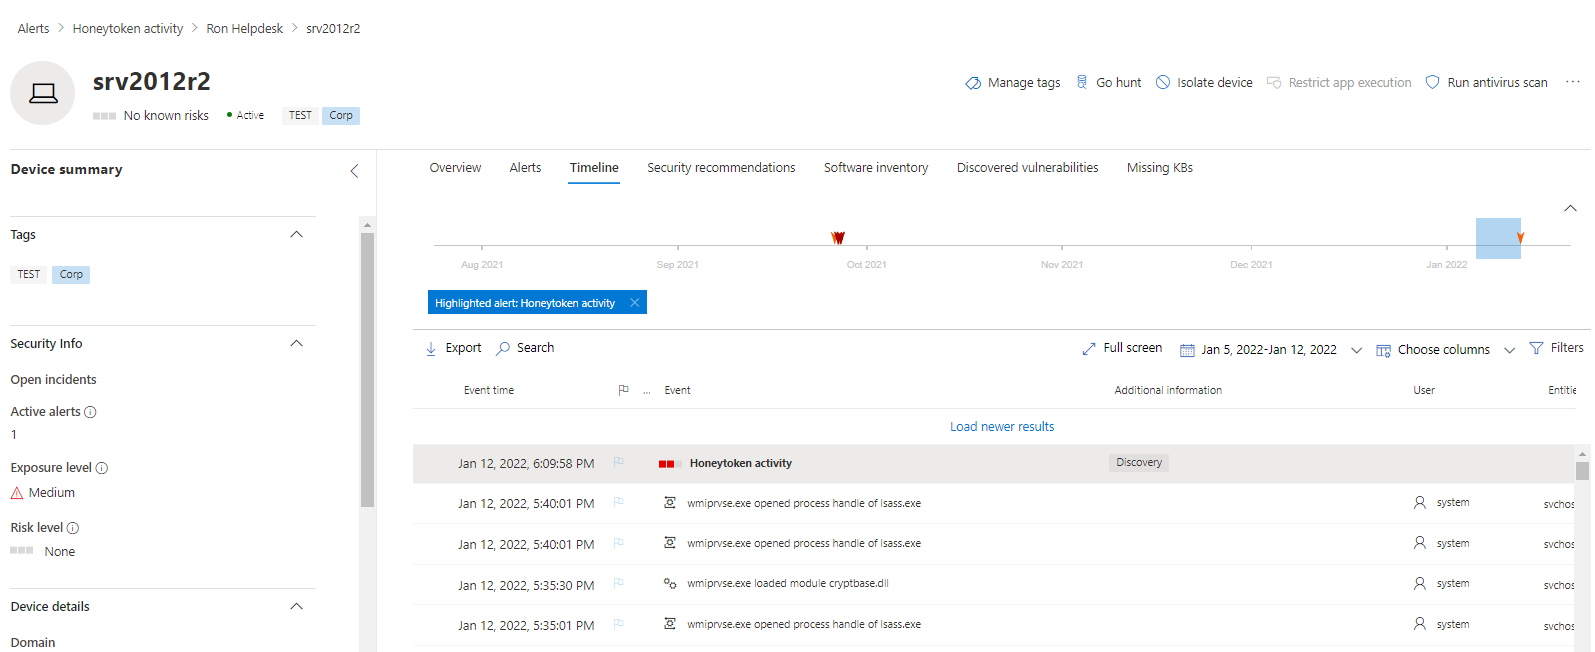
Moving on, let’s head back to the M365 Defender portal, specifically the entity page for SRV2012R2 since we know that’s the machine in question where our honeytoken account logged in. Now let’s take a look at the timeline leading up to that event, example below in Figure 1.5. Again, this is just my approach, you may drift to different things and that’s okay! What I like to do here is note anything else that might be related, either activity from other accounts or even just fileprocess activity the account might have done. For more information on what there is to see, check out the following doc – Investigate devices in the Defender for Endpoint Devices list | Microsoft Docs
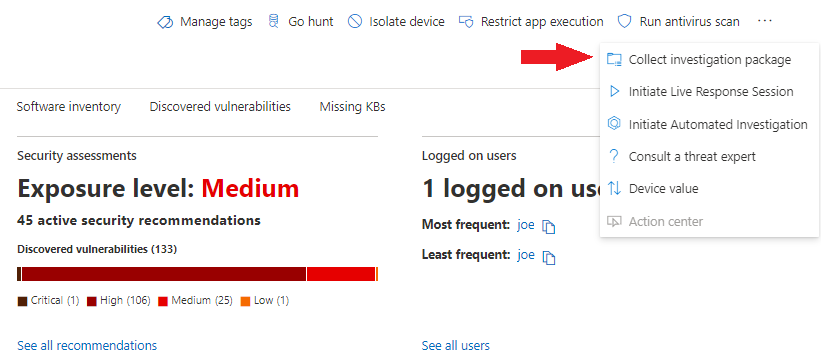
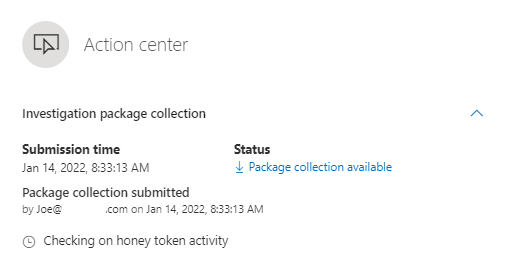
Since this is a pretty straightforward alert, I think we have about what we can get from the portals, let’s go and grab that investigation. In Figure 1.6 below, we see the device entity page and how we can collect that package, from there we’ll let it spin for a bit and then download the zip file.
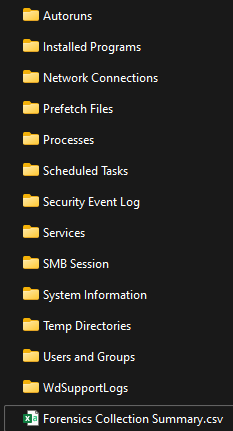
Wrapping this up, let’s dig into the package and what if offers! Figure 1.7 below is the folder structure you’ll see, as you can tell if you’re familiar with the items, it’s going to give us a current snapshot of the machine at the time we requested this. The following doc will give you an explanation of what each folder represents – Take response actions on a device in Microsoft Defender for Endpoint | Microsoft Docs
One important thing I want to call out here is the Forensics collection summary, this document shows you the commands used and run on the endpoint to go ahead and collect it. We’ll come back to that in Part 2 of this blog, where we will expand on what we can do with it in Live Sessions!
So where did we end up? We triaged the alert, took our notes and captured an array of information pertaining to the alerts and entities involved. From here we can start digging in! Join in next week for Part 2 as we peel back the covers on all this!